Guide
Introduction to Using Control Charts
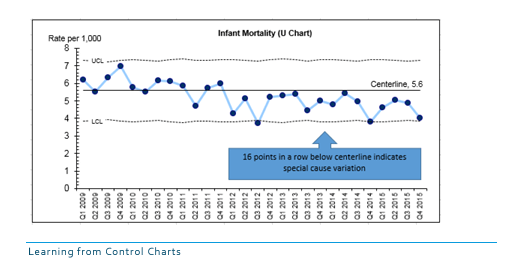
A control chart is a statistical tool that can help users identify variation and use that knowledge to inform the development of changes for improvement. In this Introduction to Control Charts, learn about the purpose, components and how to interpret control charts to guide your improvement work.
PDF
|
666 KB
Details
Date published:
August 14, 2017
